UpStream Reporting includes dozens of built in reports, with filters for every parameter, allowing you to see your data in more ways than ever.
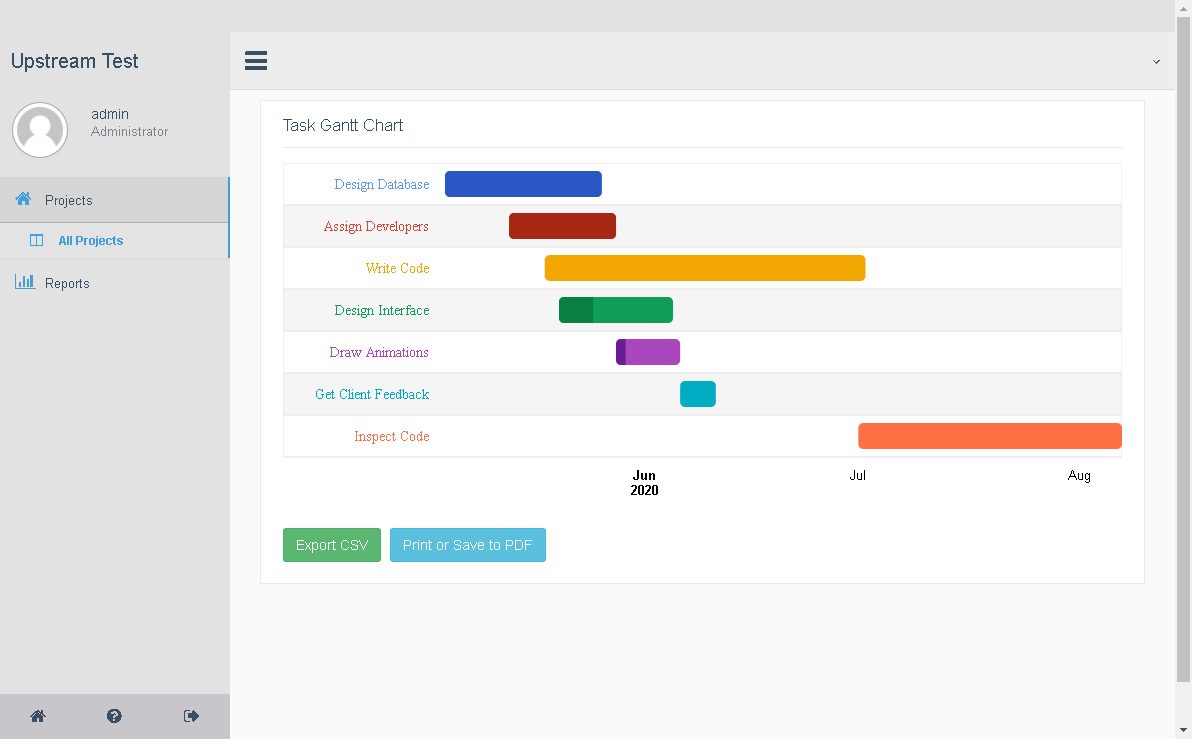
With the UpStream Reporting extension, you can create Gantt Charts, pie charts, bar graphs, calendars, tables, and more. Choose from dozens of built in reports, and filter by any combinations of parameters or custom fields to zero in on the data that you want to see.

Filter, sort, export, and print.
Want to see tasks that are assigned to Mike Jones, which are between 30% and 70% complete, and that have taken more than 55 total hours? You can do that. What to see a calendar of projects that are less than 50% complete with end dates before September 1st? You can do that too.
And UpStream reports lets you export all of our data, or any subset of data. You can even export Gantt charts.


